
Page 6 - Demo
P. 6
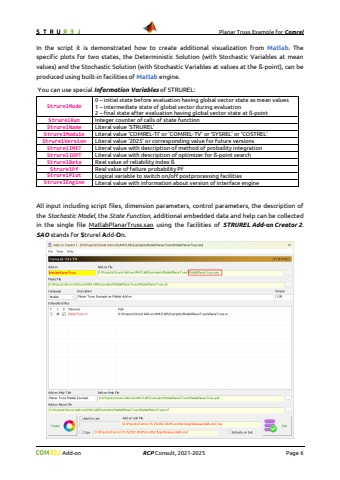
Planar Truss Example for Comrel Add-on RCP Consult, 2021-2026 Page 6 % Plot values of input data text(22, 5.5, sprintf('A1=%g m^2',A1), 'FontSize', 8); text(22, 5.2, sprintf('A2=%g m^2',A2), 'FontSize', 8); text(22, 4.9, sprintf('E1=%g N/m^2',E1), 'FontSize', 8); text(22, 4.6, sprintf('E2=%g N/m^2',E2), 'FontSize', 8); % Plot a main subtitle of plot text(-1.0, 5.5, sprintf('%s %s %s', StrurelName, StrurelModule, StrurelVersion), 'FontSize', 12); switch(StrurelMode) case 0 text(-1.0, 5.0, 'State at Mean Values', 'FontSize', 10); % input data at state of mean values case 2 text(-1.0, 5.0, sprintf('%s, %s', StrurelIMET, StrurelIOPT), 'FontSize', 10); % input data at beta-point end switch(StrurelMode) case 2 %% Stochastic Solution text(-1.0, 4.5, sprintf('beta=%g, Pf=%g', StrurelBeta, StrurelPf), 'FontSize', 10); % calculated beta and Pf end text(-1.9, -1.8, StrurelEngine, 'FontSize', 8); % invoked version of engine % Show/Export a plot % https://de.mathworks.com/matlabcentral/answers/446458-how-can-i-handle-visibility-on-off-for-plot-function switch(StrurelPlotMode) case {1,3} ff(f).Visible='on'; case 2 ff(f).Visible='off'; end % https://de.mathworks.com/help/matlab/ref/saveas.html switch(StrurelPlotMode) case {2,3} StrurelPlotCount=StrurelPlotCount+1; saveas(ff(f),sprintf('%s%d%s',StrurelPlotName,StrurelPlotCount,StrurelPlotType)); end end end end % end of plot blockend % end of functionIn the script it is demonstrated how to create additional visualization from Matlab. The specific plots for two states, the Deterministic Solution (with Stochastic Variables at mean values) and the Stochastic Solution (with Stochastic Variables at values at the %u00df-point), can be produced using built-in facilities of Matlab engine.You can use special Information Variables of STRUREL:StrurelMode0 %u2013 initial state before evaluation having global vector state as mean values1 %u2013 intermediate state of global vector during evaluation2 %u2013 final state after evaluation having global vector state at %u00df-pointStrurelRun Integer counter of calls of state functionStrurelName Literal value %u2018STRUREL%u2019StrurelModule Literal value %u2018COMREL-TI%u2019 or %u2018COMREL-TV%u2019 or %u2018SYSREL%u2019 or %u2018COSTREL%u2019StrurelVersion Literal value %u20182026%u2019 or corresponding value for future versionsStrurelIMET Literal value with description of method of probaility integrationStrurelIOPT Literal value with description of optimizer for %u00df-point searchStrurelBeta Real value of reliability index %u00dfStrurelPf Real value of failure probability PfStrurelEngine Literal value with information about version of interface engineStrurelPlot Logical variable to switch on/off postprocessing facilitiesStrurelPlotName Literal value for a base name of file for plot drawn in interface engineStrurelPlotType Literal value for an extension of file for plot drawn in interface engineStrurelPlotMode1 %u2013 shows a generated plot in a separate window2 %u2013 saves a generated plot in a file with format defined by an plot extension3 %u2013 combines mode 1 and mode 2StrurelPlotCount Integer counter of plots drawn on run. Default is 0
