
Page 15 - Demo
P. 15
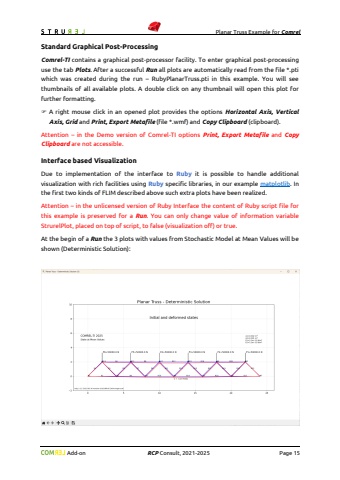
Planar Truss Example for Comrel Add-on RCP Consult, 2021-2026 Page 15Standard Graphical Post-ProcessingComrel-TI contains a graphical post-processor facility. To enter graphical post-processing use the tab Plots. After a successful Run all plots are automatically read from the file *.pti which was created during the run %u2013 RubyPlanarTruss.pti in this example. You will see thumbnails of all available plots. A double click on any thumbnail will open this plot for further formatting.%uf046 A right mouse click in an opened plot provides the options Horizontal Axis, Vertical Axis, Grid and Print, Export Metafile (file *.wmf) and Copy Clipboard (clipboard).Attention %u2013 in the Demo version of Comrel-TI options Print, Export Metafile and Copy Clipboard are not accessible.Interface based VisualizationDue to implementation of the interface to Ruby it is possible to handle additional visualization with rich facilities using Ruby specific libraries, in our example matplotlib. In the first two kinds of FLIM described above such extra plots have been realized.Attention %u2013 in the unlicensed version of Ruby Interface the content of Ruby script file for this example ispreserved for a Run. You can only change value of information variable StrurelPlot, placed on top of script, to false (visualization off) or true. Additionally, the information variable StrurelPlotMode can be defined in interval from 1 to 3 (see above).At the begin of a Run the 3 plots with values from Stochastic Model at Mean Values will be shown (Deterministic Solution):
