
Page 19 - Demo
P. 19
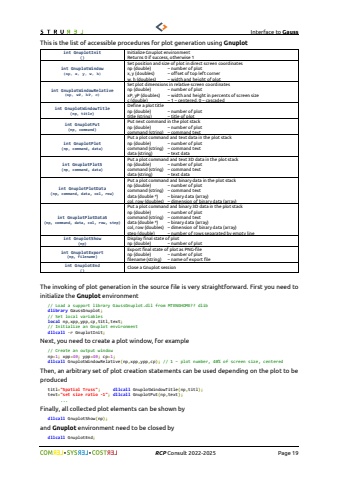
Interface to Gauss%uf09f %uf09f RCP Consult 2022-2026 Page 19This is the list of accessible procedures for plot generation using Gnuplotint GnuplotInit()Initialize Gnuplot environmentReturns 0 if success, otherwise 1int GnuplotWindow(np, x, y, w, h)Set position and size of plot in direct screen coordinatesnp (double) %u2013 number of plotx, y (doubles) %u2013 offset of top left cornerw, h (doubles) %u2013 width and height of plotint GnuplotWindowRelative(np, wP, hP, c)Set plot dimensions in relative screen coordinatesnp (double) %u2013 number of plotxP, yP (doubles) %u2013 width and height in percents of screen sizec (double) %u2013 1 %u2013 centered, 0 %u2013 cascadedint GnuplotWindowTitle(np, title)Define a plot titlenp (double) %u2013 number of plottitle (string) %u2013 title of plotint GnuplotPut(np, command)Put next command in the plot stacknp (double) %u2013 number of plotcommand (string) %u2013 command textint GnuplotPlot(np, command, data)Put a plot command and text data in the plot stacknp (double) %u2013 number of plotcommand (string) %u2013 command textdata (string) %u2013 text dataint GnuplotPlotS(np, command, data)Put a plot command and text 3D data in the plot stacknp (double) %u2013 number of plotcommand (string) %u2013 command textdata (string) %u2013 text dataint GnuplotPlotData(np, command, data, col, row)Put a plot command and binary data in the plot stacknp (double) %u2013 number of plotcommand (string) %u2013 command textdata (double *) %u2013 binary data (array)col, row (doubles) %u2013 dimension of binary data (array)int GnuplotPlotDataS(np, command, data, col, row, step)Put a plot command and binary 3D data in the plot stacknp (double) %u2013 number of plotcommand (string) %u2013 command textdata (double *) %u2013 binary data (array)col, row (doubles) %u2013 dimension of binary data (array)step (double) %u2013 number of rows separated by empty lineint GnuplotShow(np)Display final state of plotnp (double) %u2013 number of plotint GnuplotExport(np, filename)Export final state of plot as PNG-filenp (double) %u2013 number of plotfilename (string) %u2013 name of export fileint GnuplotEnd() Close a Gnuplot sessionThe invoking of plot generation in the source file is very straightforward. First you need to initialize the Gnuplot environment // Load a support library GaussGnuplot.dll from MTENGHOME?? dlib dlibrary GaussGnuplot; // Set local variables local np,xpp,ypp,cp,titl,text; // Initialize a Gnuplot environment dllcall -r GnuplotInit;Next, you need to create a plot window, for example // Create an output window np=1; xpp=40; ypp=40; cp=1; dllcall GnuplotWindowRelative(np,xpp,ypp,cp); // 1 %u2013 plot number, 40% of screen size, centeredThen, an arbitrary set of plot creation statements can be used depending on the plot to be produced titl=\dllcall GnuplotWindowTitle(np,titl); text=\...Finally, all collected plot elements can be shown by dllcall GnuplotShow(np);and Gnuplot environment need to be closed by dllcall GnuplotEnd;
