
Page 1 - Demo
P. 1
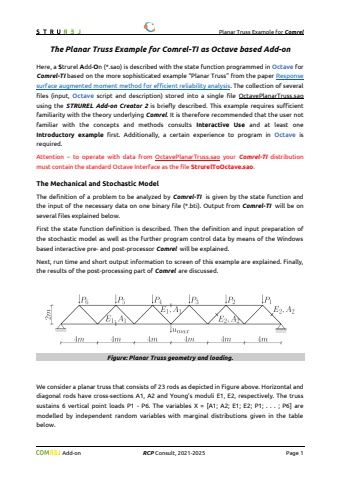
Planar Truss Example for Comrel Add-on RCP Consult, 2021-2026 Page 1The Planar Truss Example for Comrel-TI as Octave based Add-onHere, a Strurel Add-On (*.sao) is described with the state function programmed in Octave for Comrel-TI based on the more sophisticated example %u201cPlanar Truss%u201d from the paper Response surface augmented moment method for efficient reliability analysis. The collection of several files (input, Octave script and description) stored into a single file OctavePlanarTruss.saousing the STRUREL Add-on Creator 2 is briefly described. This example requires sufficientfamiliarity with the theory underlying Comrel. It is therefore recommended that the user not familiar with the concepts and methods consults Interactive Use and at least one Introductory example first. Additionally, a certain experience to program in Octave is required.Attention %u2013 to operate with data from OctavePlanarTruss.sao your Comrel-TI distribution must contain the standard Octave Interface as the file StrurelToOctave.sao.The Mechanical and Stochastic ModelThe definition of a problem to be analyzed by Comrel-TI is given by the state function and the input of the necessary data on one binary file (*.bti). Output from Comrel-TI will be on several files explained below.First the state function definition is described. Then the definition and input preparation of the stochastic model as well as the further program control data by means of the Windows based interactive pre- and post-processor Comrel will be explained.Next, run time and short output information to screen of this example are explained. Finally, the results of the post-processing part of Comrel are discussed.Figure: Planar Truss geometry and loading.We consider a planar truss that consists of 23 rods as depicted in Figure above. Horizontal and diagonal rods have cross-sections A1, A2 and Young%u2019s moduli E1, E2, respectively. The truss sustains 6 vertical point loads P1 - P6. The variables X = [A1; A2; E1; E2; P1; . . . ; P6] are modelled by independent random variables with marginal distributions given in the table below.
