
Page 6 - Demo
P. 6
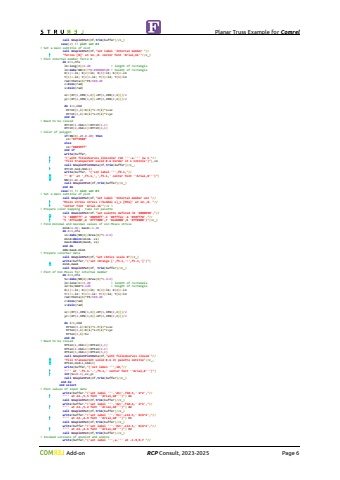
Planar Truss Example for Comrel Add-on RCP Consult, 2023-2026 Page 6! Value of vertical deflection in node N04 write(buffer,\ * \ * ac(8),XY(1,4),XY(2,4)+ac(8)*5.d0 call GnuplotPut(nf,trim(buffer)//c_) case(2) !! plot set #2! Set a main subtitle of plot call GnuplotPut(nf,\ * \! Plot internal member force N do n=1,nfe l1=leng(n)/2.d0 ! length of rectangle l2=dabs(NN(n))*0.0000005d0 ! height of rectangle X(1)=-l1; X(2)=l1; X(3)=l1; X(4)=-l1 Y(1)=-l2; Y(2)=-l2; Y(3)=l2; Y(4)=l2 rad=theta(n)*PI/180.d0 c=dcos(rad) s=dsin(rad) xc=(XY(1,IEN(1,n))+XY(1,IEN(2,n)))/2 yc=(XY(2,IEN(1,n))+XY(2,IEN(2,n)))/2 do i=1,nbd XYrot(1,i)=X(i)*c-Y(i)*s+xc XYrot(2,i)=X(i)*s+Y(i)*c+yc end do! Need to be closed XYrot(1,nbd+1)=XYrot(1,1) XYrot(2,nbd+1)=XYrot(2,1)! Color of polygon if(NN(n).gt.0.d0) then co=\ else co=\ end if write(buffer, * \ * \ call GnuplotPlotData(nf,trim(buffer)//c_, * XYrot,ned,nbd+1) write(buffer, \ * \ * NN(n),xc,yc call GnuplotPut(nf,trim(buffer)//c_) end do case(3) !! plot set #3! Set a main subtitle of plot call GnuplotPut(nf,\ * \ * \! Prepare color mapping - take Jet palette call GnuplotPut(nf,\ * \ * \! Find minimal and maximal values of von Mises stress minA=1.d6; maxA=-1.d6 do n=1,nfe vs=dabs(NN(n)/Area(n)*1.d-6) minA=dmin1(minA, vs) maxA=dmax1(maxA, vs) end do ddA=maxA-minA! Prepare colorbar data call GnuplotPut(nf,\ write(buffer,\ * minA,maxA call GnuplotPut(nf, trim(buffer)//c_)! Plot of Von Mises for internal member do n=1,nfe Sv=dabs(NN(n)/Area(n)*1.d-6) l1=leng(n)/2.d0 ! length of rectangle l2=Sv/ddA*0.2d0 ! height of rectangle X(1)=-l1; X(2)=l1; X(3)=l1; X(4)=-l1 Y(1)=-l2; Y(2)=-l2; Y(3)=l2; Y(4)=l2 rad=theta(n)*PI/180.d0 c=dcos(rad) s=dsin(rad) xc=(XY(1,IEN(1,n))+XY(1,IEN(2,n)))/2 yc=(XY(2,IEN(1,n))+XY(2,IEN(2,n)))/2 do i=1,nbd XYten(1,i)=X(i)*c-Y(i)*s+xc XYten(2,i)=X(i)*s+Y(i)*c+yc XYten(3,i)=Sv end do! Need to be closed XYten(1,nbd+1)=XYten(1,1) XYten(2,nbd+1)=XYten(2,1) XYten(3,nbd+1)=XYten(3,1) call GnuplotPlotData(nf,\ * \ * XYten,ned+1,nbd+1) write(buffer,\ * \ * int(Sv+0.1),xc,yc call GnuplotPut(nf,trim(buffer)//c_) end do end select! Plot values of input data write(buffer,\ * \ call GnuplotPut(nf,trim(buffer)//c_) write(buffer,\ * \ call GnuplotPut(nf,trim(buffer)//c_) write(buffer,\ * \ call GnuplotPut(nf,trim(buffer)//c_) write(buffer,\
