
Page 13 - Demo
P. 13
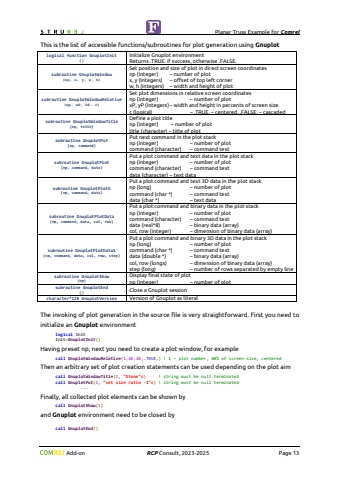
Planar Truss Example for Comrel Add-on RCP Consult, 2023-2026 Page 13Both kinds of state function from FLIM(1) to FLIM(2) compute absolutely identical results. For each of them we will demonstrate how to create additional visualization from FORTRAN. The specific plots for two states, such as Deterministic Solution and Stochastic Solution, can be produced using rich facilities of portable command-line driven graphing utility Gnuplot. First you need to register the Gnuplot tool in the environment of STRUREL. The FORTRAN interface contains different built-in procedures for communication with Gnuplot. Press key F2 in the STRUREL module to open the Preferences Dialog Box. Go to position Buildout Add-onsand check for registration of GNUPLOT.EXEYou can use special Information Variables of STRUREL:StrurelMode0 %u2013 initial state before evaluation having global vector state as mean values1 %u2013 intermediate state of global vector during evaluation2 %u2013 final state after evaluation having global vector state at %u00df-pointStrurelRun Integer counter of calls of state functionStrurelName Literal value %u2018STRUREL%u2019StrurelModule Literal value %u2018COMREL-TI%u2019 or %u2018COMREL-TV%u2019 or %u2018SYSREL%u2019 or %u2018COSTREL%u2019StrurelVersion Literal value %u20182026%u2019 or corresponding value for future versionsStrurelIMET Literal value with description of method of probaility integrationStrurelIOPT Literal value with description of optimizer for %u00df-point searchStrurelBeta Real value of reliability index %u00dfStrurelPf Real value of failure probability PfStrurelEngine Literal value with information about version of interface engineStrurelPlot Logical variable to switch on/off postprocessing facilitiesStrurelPlotName Literal value for a base name of file for plot drawn in interface engineStrurelPlotType Literal value for an extension of file for plot drawn in interface engineStrurelPlotMode1 %u2013 shows a generated plot in a separate window2 %u2013 saves a generated plot in a file with format defined by an plot extension3 %u2013 combines mode 1 and mode 2StrurelPlotCount Integer counter of plots drawn on run. Default is 0
