
Page 14 - Demo
P. 14
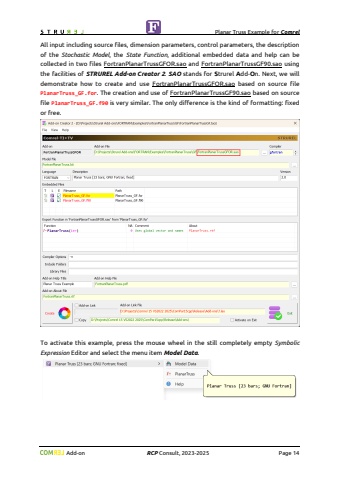
Planar Truss Example for Comrel Add-on RCP Consult, 2023-2026 Page 14This is the list of accessible functions/subroutines for plot generation using Gnuplotlogical function GnuplotInit()Initialize Gnuplot environmentReturns .TRUE. if success, otherwise .FALSE.subroutine GnuplotWindow(np, x, y, w, h)Set position and size of plot in direct screen coordinatesnp (integer) %u2013 number of plotx, y (integers) %u2013 offset of top left cornerw, h (integers) %u2013 width and height of plotsubroutine GnuplotWindowRelative(np, wP, hP, c)Set plot dimensions in relative screen coordinatesnp (integer) %u2013 number of plotxP, yP (integers) %u2013 width and height in percents of screen sizec (logical) %u2013 .TRUE. %u2013 centered, .FALSE. %u2013 cascadedsubroutine GnuplotWindowTitle(np, title)Define a plot titlenp (integer) %u2013 number of plottitle (character) %u2013 title of plotsubroutine GnuplotPut(np, command)Put next command in the plot stacknp (integer) %u2013 number of plotcommand (character) %u2013 command textsubroutine GnuplotPlot(np, command, data)Put a plot command and text data in the plot stacknp (integer) %u2013 number of plotcommand (character) %u2013 command textdata (character) %u2013 text datasubroutine GnuplotPlotS(np, command, data)Put a plot command and text 3D data in the plot stacknp (long) %u2013 number of plotcommand (char *) %u2013 command textdata (char *) %u2013 text datasubroutine GnuplotPlotData(np, command, data, col, row)Put a plot command and binary data in the plot stacknp (integer) %u2013 number of plotcommand (character) %u2013 command textdata (real*8) %u2013 binary data (array)col, row (integer) %u2013 dimension of binary data (array)subroutine GnuplotPlotDataS(np, command, data, col, row, step)Put a plot command and binary 3D data in the plot stacknp (long) %u2013 number of plotcommand (char *) %u2013 command textdata (double *) %u2013 binary data (array)col, row (longs) %u2013 dimension of binary data (array)step (long) %u2013 number of rows separated by empty linesubroutine GnuplotShow(np)Display final state of plotnp (integer) %u2013 number of plotsubroutine GnuplotExport(np, filename)Export final state of plot as PNG-filenp (integer) %u2013 number of plotfilename (character) %u2013 name of export filesubroutine GnuplotEnd() Close a Gnuplot sessioncharacter*128 GnuplotVersion Version of Gnuplot as literalThe invoking of plot generation in the source file is very straightforward. First you need to initialize an Gnuplot environment logical Init Init=GnuplotInit()Having preset np, next you need to create a plot window, for example call GnuplotWindowRelative(1,40,40,.TRUE.) ! 1 %u2013 plot number, 40% of screen size, centeredThen an arbitrary set of plot creation statements can be used depending on the plot aim call GnuplotWindowTitle(1, \! string must be null terminated call GnuplotPut(1, \...Finally, all collected plot elements can be shown by call GnuplotShow(1)and Gnuplot environment need to be closed by call GnuplotEnd()
